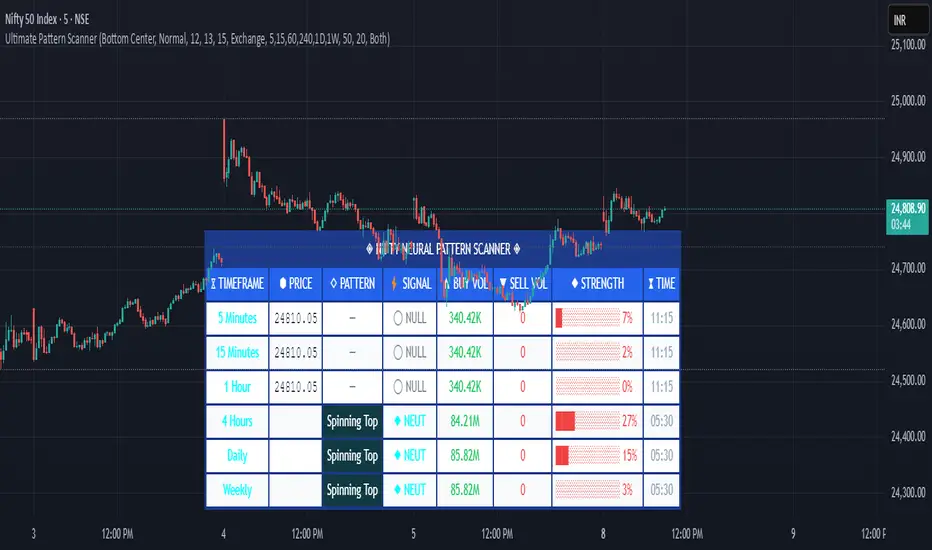
Pattern ScannerUltimate Pattern Scanner — multi-timeframe candlestick discovery tool (educational use only).
Purpose: This script scans user-selected timeframes for classical candlestick patterns (for example: engulfing, morning/evening stars, hammers, dojis, tasuki gaps, three soldiers/crows, tweezers, marubozu, and others) and reports pattern name, detection price, directional signal (Bull / Bear / Neutral), and a simple volume participation metric. It is intended as an idea-generation and training tool to help traders learn pattern mechanics, not as an automated trading system.
Main modules and rationale: 1) Pattern engine — applies classical candle structure rules to detect formations; 2) SMA trend filter (configurable length) — provides a directional bias to favor trade-with-trend setups; 3) Volume heuristic — approximates participation by separating candles into buy-like and sell-like volume and comparing total volume to a moving average; 4) Multi-timeframe aggregator — collects and presents pattern results from multiple timeframes; 5) Alerts — optional alerts list detected patterns and TFs. Combining these modules is intentional: patterns provide structure, SMA provides context, and volume supplies participation confirmation. Together they improve the educational value and practical relevance of each detected pattern.
How to use: Choose timeframes and SMA length that match your trading horizon. Use the scanner to locate pattern candidates, then confirm with higher-timeframe agreement and volume ratio before considering trade entry. Use structural stops (recent swing highs/lows or ATR-based stops) and define risk:reward rules. For learning, replay alerted bars and record outcomes over fixed horizons to build empirical statistics.
Limitations: Volume classification (close>open) is a heuristic and not a true bid/ask tape. SMA is a lagging trend proxy. Multi-timeframe agreement reduces but does not eliminate false signals, especially around news or in low-liquidity instruments. Use demo accounts and backtesting before live trading.
Inputs you can adjust: timeframe list, SMA length, volume MA length, which patterns to enable/disable, display options.
Compliance notes: This description explains why modules are combined and what the script does without exposing source code logic; it is non-promotional and contains no contact links. Remove any trademark symbols unless registration details are provided.
Risk Disclaimer: This tool is provided for education and analysis only. It is not financial advice and does not guarantee returns. Users assume all risk for trades made based on this script. Backtest thoroughly and use proper risk management.
ابحث في النصوص البرمجية عن "swing high"
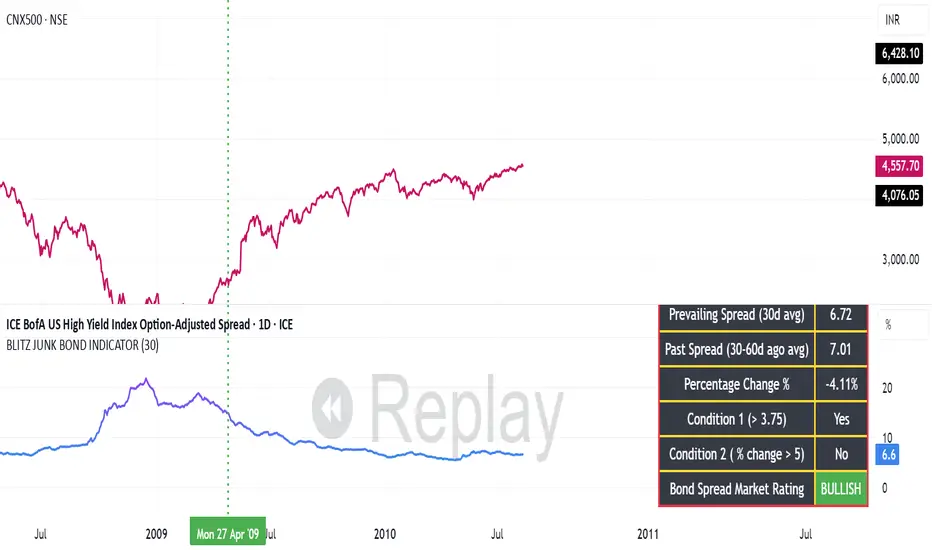
BLITZ JUNK BOND INDICATORThe given indicator considers the fluctuations in the bond market and the spread that are existing as a premium demanded by investors for high risk corporate junk bonds.
1. The junk bond spread indicator precisely anticipates market phases, especially any panic kind of scenario.
2. Junk bond spread indicator often face choppy market zone and entirely we must rely on our portfolio churning skills if such scenario occurs and the broader markets failed to perform even if the indicator has made us to make a buy position
3. Whenever Bullish signal comes, same is to be confirmed with the price action of the broader market index, then same to be confirmed in the junk bond spreads chart if the spreads are going down steadily or is breaking down from the nearest swing low and cooling off. This, scenario indicates we must expose our portfolio to equities
4. Whenever Bearish signal comes, same to be cofirmed with the price action of the broader market index, then same to be confirmed in the junk bond spread charts if the spreads are heating up breaking nearby swing highs or steadily moving up. In such scenario, we must prepare for heavy market drawdowns or must anticipate some panic scenario in the markets and thus should avoid equities.
Session & Swing Levels + Smart AlertsMulti-Timeframe Level Tracker with Advanced Alert System
This comprehensive indicator combines session-based trading levels with multi-timeframe swing analysis, for key level identification and alert management.
Key Features:
Session Analysis:
Asia Session (7:00 PM - 4:00 AM ET) - Tracks high/low levels during Asian market hours
London Session (3:00 AM - 11:00 AM ET) - Identifies key European session levels
Previous Day Levels - Displays prior day's high and low levels
Visual session backgrounds and customizable timezone support
Multi-Timeframe Swing Detection:
Up to 5 configurable timeframes (default: 15m, 1h, 4h, 1D, 1W)
Intelligent swing high/low identification using customizable pivot strength
Each timeframe uses distinct colors for easy identification
Advanced Alert System:
Anti-repainting protection - Alerts only trigger on confirmed bars for reliable live trading
Specific alert messages for each level type (Asia High, London Low, Previous Day levels, etc.)
Individual alert toggles for each session and timeframe
Timestamps in Eastern Time for consistency
Visual Customization:
Independent color schemes for sessions and timeframes
Configurable line styles (solid, dashed, dotted) and widths
Separate styling for active vs. mitigated levels
Optional line extension past mitigation points
📊 How It Works:
Level Creation: Automatically identifies and draws key levels at session closes
Mitigation Detection: Monitors price interaction with levels in real-time
Visual Updates: Changes line appearance when levels are crossed
Smart Alerts: Sends targeted notifications with level-specific information

VWAP Confluência 3x VWAP Confluence 3x — Daily · Weekly · Anchored
Purpose
A pragmatic VWAP suite for execution and risk management. It plots three institutional reference lines: Daily VWAP, Weekly VWAP, and an Anchored VWAP (AVWAP) starting from a user-defined event (news, earnings, session open, swing high/low).
Why it matters
VWAP is the market’s “fair price” weighted by where volume actually traded. Confluence across timeframes and events turns noisy charts into actionable bias and clean levels.
What it does
Daily VWAP — resets each trading day; intraday “fair value.”
Weekly VWAP — resets each week; swing context and larger player defense.
Anchored VWAP — starts at a precise timestamp you set (e.g., news release).
Price source toggle — Typical Price
(
𝐻
+
𝐿
+
𝐶
)
/
3
(H+L+C)/3 or Close.
Visibility switches — enable/disable each line independently.
Anchor marker — labels the first bar of the AVWAP.
Inputs
Show Daily VWAP (on/off)
Show Weekly VWAP (on/off)
Show Anchored VWAP (on/off)
Price Source: Typical (H+L+C)/3 or Close
Anchor Time: timestamp of your event (uses the chart/exchange timezone)
How to anchor to a news event
Find the exact release time as shown in your chart’s timezone.
Open the indicator settings → set Anchor Time to that minute.
The AVWAP begins at that bar and accumulates forward.
Playbook (examples, not signals)
Strong long bias: price above Daily and Weekly VWAP; AVWAP reclaimed after news.
Strong short bias: price below Daily and Weekly; AVWAP reject after news.
Mean-revert zones: price stretches far from the active VWAPs and snaps back; size around VWAP with tight risk.
Targets: opposite VWAP, prior day/week highs/lows, or liquidity pools near AVWAP.
Best used with
Session highs/lows, liquidity sweeps, volume profile, and time-of-day filters.
Notes & limitations
Works best on markets with reliable volume (equities, futures, liquid crypto). FX spot uses synthetic volume—interpret accordingly.
Anchor Time respects the chart’s timezone. Convert news times before setting.
This is an indicator, not a backtestable strategy. No trade advice.
Disclaimer
For educational purposes only. Trading involves risk. Do your own research and manage risk responsibly.

Lumiere’s Indicator BundleThe Lumiere’s Indicator Bundle combines three of Lumiere’s most used tools into one script:
🔹 BOS Mark-out – Marks Breaks of Structure with clear bullish/bearish levels and optional alerts.
🔹 Liquidity Mark-ou t – Draws significant swing highs/lows and automatically removes them once swept.
🔹 Trading Session High/Low – Tracks Asia, London, and New York session ranges with customizable timezone.
Why this bundle?
I made this bundle so everyone can run all my indicators at once without having to pick and choose between them or worry about chart space limits.
Instead of loading 3 separate indicators, this package gives you everything in one place. You can toggle each module (BOS, Liquidity, Sessions) on or off from the settings. All inputs are kept clean and organized in their own sections for easy adjustments.
What to expect
BOS lines always plotted on top for maximum clarity.
Liquidity highs/lows update in real time and get removed when taken out.
Session ranges show the active session’s high/low and can mark sweeps after the session closes.
Default timezone is New York (UTC-4), but you can switch to any TradingView-supported timezone.
BOS alerts are included, so you’ll never miss a structural break.

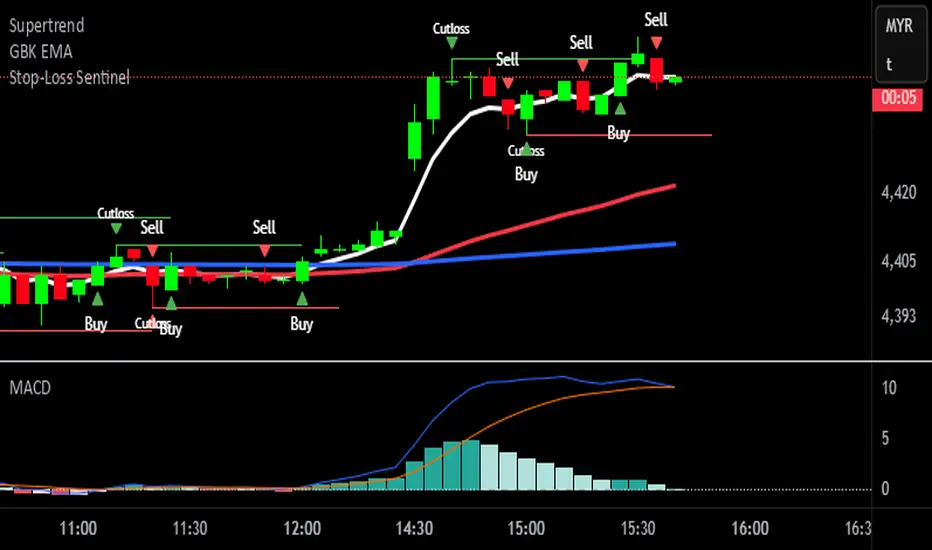
Stop-Loss Sentinel
Cutloss Swing Marker with Adjustable Trend Lines
This indicator identifies swing highs and lows using pivot points.
Swing Highs are marked with a green downward triangle and a "Cutloss" label above the bar.
Swing Lows are marked with a red upward triangle and a "Cutloss" label below the bar.
From each Cutloss point, a horizontal trend line is drawn forward for a set number of bars.
All colors (text, trend lines) and line length are fully adjustable in the settings.
Intended Use:
Helps traders visually mark potential stop-loss or reversal zones and track them over the next few bars. Works on any timeframe, but is designed for fast decision-making on lower timeframes like M1.
Marks key swing highs/lows with ‘Cutloss’ labels and triangles, then extends customizable trend lines for the next bars. Ideal for spotting stop-loss or reversal zones on any timeframe.
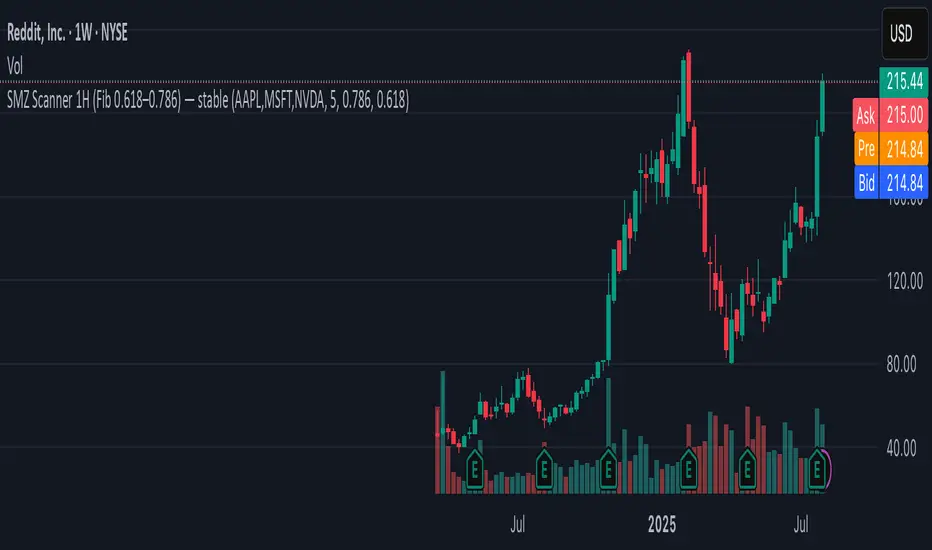
SMZ Scanner 1H (Fib 0.618–0.786) — stableQuickly spot when your watchlist tickers enter high-probability Smart Money Zones. This scanner checks up to 40 symbols on 1-hour candles, using the 0.618–0.786 Fibonacci retracement of the latest impulse leg (based on swing highs/lows).
What it does:
• Scans your custom list of tickers (up to 40 at once).
• Identifies fresh bullish or bearish impulses.
• Marks when price enters the key Fib retracement zone.
• Sends one clean alert per bar with all tickers that just hit.
Perfect for:
Swing traders and intraday traders tracking Smart Money Zone re-entries without flipping through dozens of charts.
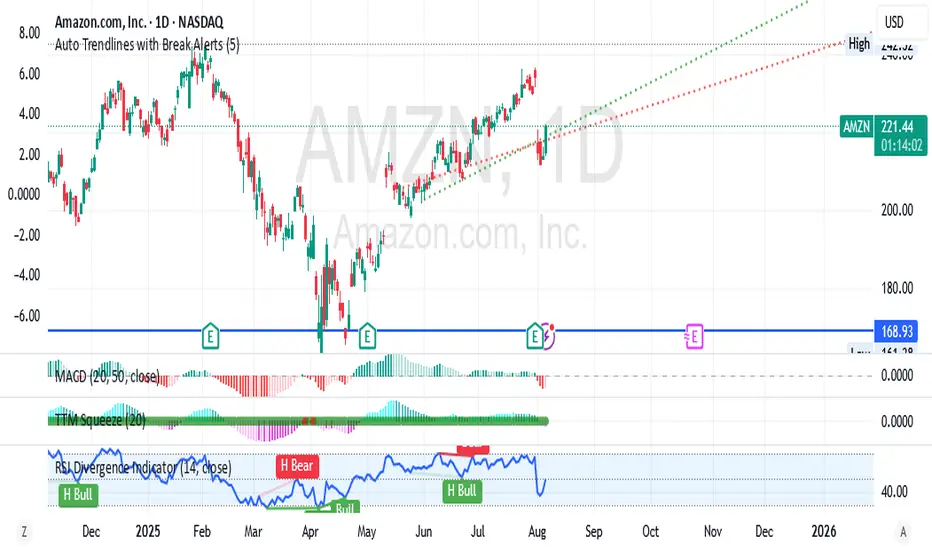
Auto Trendlines with Break AlertsIdentify the two most recent significant swing highs and swing lows based on a customizable pivot length.
Draw trendlines extending from these points.
Provide an optional visual signal (a small diamond on the chart) and a alertcondition for sound/push notifications when a trendline is broken.
Configure: Once the indicator is on your chart, you can click on the gear icon (⚙️) next to its name to adjust the settings. You will see a checkbox to enable/disable alerts and a slider to change the pivot length.
Configuring Alerts in TradingView
The alertcondition lines in the code allow you to set up official TradingView alerts for sound and push notifications.
Create an Alert: Click the clock icon (⏰) on the right-side toolbar of your TradingView chart.
Set the Condition: In the "Condition" field, select the name of the indicator: "Auto Trendlines with Break Alerts".
Choose the Alert Type: A second dropdown will appear. Select either "High Trendline Broken" or "Low Trendline Broken" to specify which break you want to be alerted for.
Select Notification Options: In the "Notifications" section, you can check the boxes for "Play sound," "Send email," "Send push notification," etc.
Create the Alert: Click "Create" to save your alert.
Buy Sell Magic Rework📌 Purpose
This script is a reworked version of the Parabolic SAR strategy, with an optional ZigZag filter to confirm reversal points.
It helps traders identify potential trend reversals with reduced noise compared to the standard SAR.
🧠 How It Works
1. Parabolic SAR Flip Signals
Buy Signal: Triggered when SAR flips from above price to below price.
Sell Signal: Triggered when SAR flips from below price to above price.
(Default SAR parameters: Start = 0.02, Increment = 0.02, Max = 0.2)
2. ZigZag Filter (Optional)
When Use ZigZag Filter = true:
The script confirms reversals only at significant pivots (swing highs/lows) detected by the ZigZag algorithm over the selected ZigZag Period (default = 14 bars).
Buy Signal: Appears only when a new pivot low is detected.
Sell Signal: Appears only when a new pivot high is detected.
3. Trade-Off
Without ZigZag: More signals, more noise.
With ZigZag: Fewer signals, but stronger confirmation and reduced false entries.
📈 How to Use
Signals appear as green arrows for buy and red arrows for sell.
Works well for:
Trend reversal detection.
Swing trading confirmation.
Filtering entries for other systems.
Recommended Timeframes: 15m, 1h, 4h.
Markets: Forex, Crypto, Stocks.
⚙️ Inputs
ZigZag Period (bars for pivot detection)
SAR Start / Increment / Max (SAR parameters)
Use ZigZag Filter (toggle for confirmation)
⚠️ Disclaimer
This script is for educational purposes only. It does not constitute financial advice.
Always test thoroughly before live trading.

Momentum Reversal StrategyBEST USE IN 15MIN TIME FRAME EURUSD / XAUSUD
1. Strategy Overview
This strategy hunts short-term momentum reversals at key levels during high-liquidity sessions.
Timeframes: 5-minute for entries; 15-minute for trend context
Sessions: London for EUR/USD & GBP/USD; New York for XAU/USD
Pairs: EUR/USD, GBP/USD, XAU/USD
Indicators (3 max):
EMA(20) and EMA(50) (close)
MACD (12, 26, 9) histogram
Optional: RSI(14) (for divergence filter)
2. Entry Rules
Trend Filter (15 min):
Long only if EMA20 > EMA50; short only if EMA20 < EMA50.
Price-Action Zone (5 min):
Identify recent swing high/low within past 20 bars.
Draw horizontal support (for longs) or resistance (for shorts).
Indicator Alignment (5 min):
MACD histogram crossing from negative to positive for longs, positive to negative for shorts.
Candle close beyond EMA20 in direction of trade.
Candle Confirmation:
Bullish engulfing or hammer at support for longs; bearish engulfing or shooting star at resistance for shorts.
Entry Execution:
Place market order on candle close that meets all above.
3. Exit Rules
Stop-Loss (SL):
Long: 1.5× ATR(14) below entry candle low.
Short: 1.5× ATR(14) above entry candle high.
Take-Profit (TP):
Set at 2× SL distance (RR 1:2).
Trailing SL:
After price moves 1× SL in profit, trail SL to breakeven.
Partial Booking:
Close 50% at 1× SL (50% of TP), move SL to entry.
Close remaining at full TP.
4. Trade Management
False Signal Filter: Skip trades when RSI(14) > 70 for longs or < 30 for shorts (avoids overbought/oversold extremes).
One Trade at a Time: No multiple positions on same pair.
Session Cutoff: Close any open trade 15 minutes before session end.
5. Risk Parameters
Risk per Trade: 1% of account equity.
Reward Target: ≥2% (1:2 RR) per trade.
Win-Rate Expectancy: ≥75% based on indicator confluence and price-action confirmation.

50/100 EMA Crossover with Candle Confirmation📘 **50/100 EMA Crossover with Candle Confirmation – Strategy Description**
The **50/100 EMA Crossover with Candle Confirmation** is a trend-following strategy designed to filter high-probability entries by combining exponential moving average (EMA) crossovers with strong price action confirmation. This strategy aims to reduce false signals commonly associated with EMA-only systems by requiring a **candle close confirmation in the direction of the trend**, making it more reliable for intraday or swing trading across Forex, crypto, and stock markets.
---
### 🔍 **Core Logic**
* The strategy is based on the interaction of the **50 EMA** (fast-moving average) and the **100 EMA** (slow-moving average).
* **Trend direction** is determined by the crossover:
* **Bullish Trend**: When the 50 EMA crosses **above** the 100 EMA.
* **Bearish Trend**: When the 50 EMA crosses **below** the 100 EMA.
* To **filter out false breakouts**, a **candle confirmation** is used:
* For a **Buy signal**: After a bullish crossover, wait for a strong bullish candle (e.g., full-body green candle) to **close above both EMAs**.
* For a **Sell signal**: After a bearish crossover, wait for a strong bearish candle to **close below both EMAs**.
---
### ✅ **Entry Conditions**
**Buy Entry:**
* 50 EMA crosses above 100 EMA.
* Latest candle closes **above both EMAs**.
* Candle must be bullish (green/full body preferred).
**Sell Entry:**
* 50 EMA crosses below 100 EMA.
* Latest candle closes **below both EMAs**.
* Candle must be bearish (red/full body preferred).
---
### 🛑 **Exit or Take-Profit Options**
* **Fixed TP/SL**: 1:2 or 1:3 risk-reward.
* **Trailing Stop**: Based on recent swing highs/lows or ATR.
* **EMA Exit**: Exit trade when the candle closes on the opposite side of 50 EMA.
---
### ⚙️ **Best Settings**
* **Timeframes**: 5M, 15M, 1H, 4H (works well on most).
* **Markets**: Forex, Crypto (e.g., BTC/ETH), Indices (e.g., NASDAQ, NIFTY50).
* **Recommended filters**:
* Use with RSI divergence or volume confirmation.
* Avoid using during high-impact news (especially on lower timeframes).
---
### 🧠 **Why This Works**
The 50/100 EMA crossover provides a **medium-term trend signal**, reducing noise seen in fast EMAs (like 9 or 21). The candle confirmation adds a **momentum filter**, ensuring price supports the directional bias. This makes it suitable for traders who want a balance of trend and entry precision without overcomplicating with too many indicators.
---
### 📈 **Advantages**
* Simple yet effective for identifying trends.
* Filters out fakeouts using candle confirmation.
* Easy to automate in Pine Script or other trading bots.
* Can be combined with support/resistance or SMC zones for better confluence.
---
### ⚠️ **Limitations**
* May lag slightly in ranging markets.
* Late entries possible due to confirmation candle.
* Works best with additional volume or volatility filter.

Liquidity Swings [Nix]Liquidity Swings Indicator!
It marks recent swing highs and lows on the chart using lines and labels.
Another great feature is that it tracks whether those swing levels are SWEPT (price crosses them again) and either:
Removes swept levels, or
Fades them to indicate they’ve been taken.
You can customize:
Number of swings shown.
Colors, styles, and visibility of lines/labels.
Whether to show highs, lows, or both.
Useful for liquidity analysis.
Usually when these special swings are swept, you can consider moving stops to BE. This is because there should be enough stop losses at the swing points to liquidate others and give more fuel to your trade direction!

PulseWave + DivergenceOverview
PulseWave + Divergence is a momentum oscillator designed to optimize the classic RSI. Unlike traditional RSI, which can produce delayed or noisy signals, PulseWave offers a smoother and faster oscillator line that better responds to changes in market dynamics. By using a formula based on the difference between RSI and its moving average, the indicator generates fewer false signals, making it a suitable tool for day traders and swing traders in stock, forex, and cryptocurrency markets.
How It Works
Generating the Oscillator Line
The PulseWave oscillator line is calculated as follows:
RSI is calculated based on the selected data source (default: close price) and RSI length (default: 20 periods).
RSI is smoothed using a simple moving average (MA) with a selected length (default: 20 periods).
The oscillator value is the difference between the current RSI and its moving average: oscillator = RSI - MA(RSI).
This approach ensures high responsiveness to short-term momentum changes while reducing market noise. Unlike other oscillators, such as standard RSI or MACD, which rely on direct price values or more complex formulas, PulseWave focuses on the dynamics of the difference between RSI and its moving average. This allows it to better capture short-term trend changes while minimizing the impact of random price fluctuations. The oscillator line fluctuates around zero, making it easy to identify bullish trends (positive values) and bearish trends (negative values).
Divergences
The indicator optionally detects bullish and bearish divergences by comparing price extremes (swing highs/lows) with oscillator extremes within a defined pivot window (default: 5 candles left and right). Divergences are marked with "Bull" (bullish) and "Bear" (bearish) labels on the oscillator chart.
Signals
Depending on the selected signal type, PulseWave generates buy and sell signals based on:
Crosses of the overbought and oversold levels.
Crosses of the oscillator’s zero line.
A combination of both (option "Both").
Signals are displayed as triangles above or below the oscillator, making them easy to identify.
Input Parameters
RSI Length: Length of the RSI used in calculations (default: 20).
RSI MA Length: Length of the RSI moving average (default: 20).
Overbought/Oversold Level: Oscillator overbought and oversold levels (default: 12.0 and -12.0).
Pivot Length: Number of candles used to detect extremes for divergences (default: 5).
Signal Type: Type of signals to display ("Overbought/Oversold", "Zero Line", "Both", or "None").
Colors and Gradients: Full customization of line, gradient, and label colors.
How to Use
Adjust Parameters:
Increase RSI Length (e.g., to 30) for high-volatility markets to reduce noise.
Decrease Pivot Length (e.g., to 3) for faster divergence detection on short timeframes.
Interpret Signals:
Buy Signal: The oscillator crosses above the oversold level or zero line, especially with a bullish divergence.
Sell Signal: The oscillator crosses below the overbought level or zero line, especially with a bearish divergence.
Combine with Other Tools:
Use PulseWave alongside moving averages or support/resistance levels to confirm signals.
Monitor Divergences:
"Bull" and "Bear" labels indicate potential trend reversals. Set up alerts to receive notifications for divergences.

BAFD (Price Action For D.....s)🧠 Overview
This indicator combines multiple Moving Averages (MA) with visual price action elements such as Fair Value Gaps (FVGs) and Swing Points. It provides traders with real-time insight into trend direction, structural breaks, and potential entry zones based on institutional price behavior.
⚙️ Features
1. Multi MA Visualization (SMA & EMA)
- Plots short-, mid-, and long-term moving averages
- Fully customizable: MA type (SMA/EMA) and length per MA
- Dynamic color coding: green for bullish, red for bearish (based on close >/< MA)
2. Fair Value Gaps (FVG) Detection
Detects bullish and bearish imbalances using multiple logic types:
- Same Type: Last 3 candles move in the same direction
- Twin Close: Last 2 candles close in the same direction
- All: Shows all valid FVGs regardless of pattern
Gaps are marked with semi-transparent yellow boxes
Useful for identifying potential liquidity voids and retest zones
3. Swing Highs and Lows
- Automatically identifies major swing points
- Customizable sensitivity (strength setting)
Marked with subtle colored dots for structure identification or support/resistance mapping
📈 Use Cases
- Trend Identification: Visualize momentum on multiple timeframes
- Liquidity Mapping: Spot potential retracement zones using FVGs
- Confluence Building: Combine MA slope, FVG zones, and swing points for refined setups
🛠️ Customizable Settings
- Moving average type and length for each MA
- FVG logic selection and color
- Swing point strength
🔔 Note
This script does not generate buy/sell signals or alerts. It is designed as a visual decision-support tool for discretionary traders who rely on market structure, trend, and price action.

AsturRiskPanelIndicator Summary
ATR Engine
Length & Smoothing: Choose how many bars to use (default 14) and the smoothing method (RMA/SMA/EMA/WMA).
Median ATR: Computes a rolling median of ATR over a user-defined look-back (default 14) to derive a “scalp” target.
Scalp Target
Automatically set at ½ × median ATR, snapped to the nearest tick.
Optional rounding to whole points for simplicity.
Stop Calculation
ATR Multiplier: Scales current ATR by a user input (default 1.5) to produce your stop distance in points (and ticks when appropriate).
Distortion Handling: Switches between point-only and point + tick displays based on contract specifications.
Risk & Sizing
Risk % of account per trade (default 2 %).
Calculates dollar risk per contract and optimal contract count.
Displays all metrics (scalp, stop, risk/contract, max contracts, max risk, account size) in a customizable on-chart table.
ATR-Based Stop Placement Guidelines
Trade Context ATR Multiplier Notes
Tight Range Entry 1.0 × ATR High-conviction, precise entries. Expect more shake-outs.
Standard Trend Entry 1.5 × ATR Balanced for H2/L2, MTR, DT/DB entries.
Breakouts/Microchannels 2.0 × ATR Wide stops through chop—Brooks-style breathing room.
How to Use
Select ATR Settings
Pick an ATR length (e.g. 14) and smoothing (RMA for stability).
Adjust the median length if you want a faster/slower scalp line.
Align Multiplier with Your Setup
For tight-range entries, set ATR Multiplier ≈ 1.0.
For standard trend trades, leave at 1.5.
For breakout/pullback setups, increase to 2.0 or more.
Customize Risk Parameters
Enter your account size and desired risk % per trade (e.g. 2 %).
The table auto-calculates how many contracts you can take.
Read the On-Chart Table
Scalp shows your intraday target.
Stop gives Brooks-style stop distance in points (and ticks).
Risk/Contract is the dollar risk per contract.
Max Contracts tells you maximum position size.
Max Risk confirms total dollar exposure.
Visual Confirmation
Place your entry, then eyeball the scalp and stop levels against chart structure (e.g. swing highs/lows).
Adjust the ATR multiplier if market context shifts (e.g. volatility spikes).
By blending this sizing panel with contextual ATR multipliers, you’ll consistently give your trades the right amount of “breathing room” while keeping risk in check.

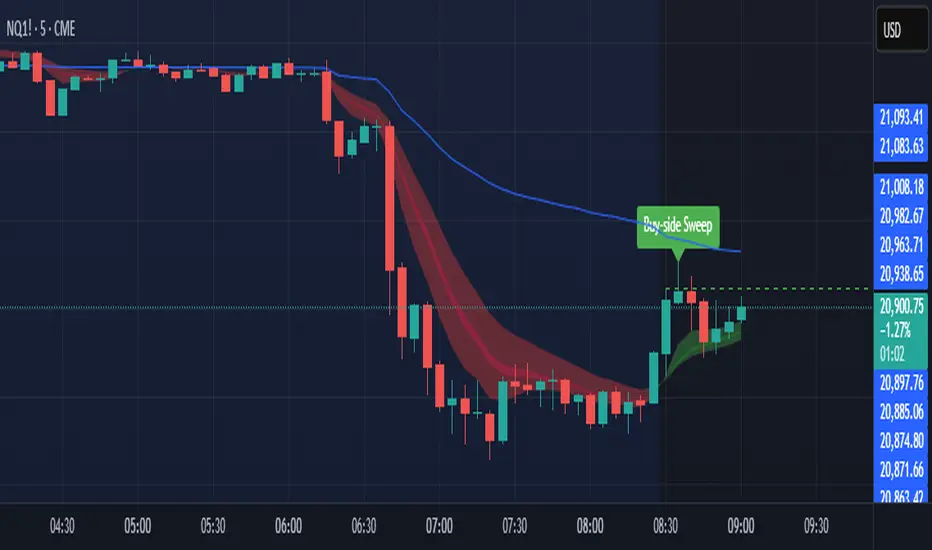
Sniper SweepsPurpose
Detect when price sweeps above recent highs (buy-side liquidity) or below recent lows (sell-side liquidity), but closes back inside the range. This is often interpreted as a stop-hunt or liquidity grab by institutional traders.
Core Concepts
Liquidity Sweep: When price briefly breaks a recent swing high/low (potentially triggering stop losses), but then closes back within the previous range.
Buy-side Sweep: Price breaks a previous high, but closes below it.
Sell-side Sweep: Price breaks a previous low, but closes above it.
Summary
This indicator is useful for:
Identifying potential stop-hunts or liquidity grabs.
Recognizing SMC trade setups around swept highs/lows.
Getting alerted when significant liquidity levels are manipulated.
Anchored VWAP by Time (Math by Thomas)📄 Description
This tool lets you plot an Anchored Volume Weighted Average Price (VWAP) starting from any specific date and time you choose. Unlike standard VWAPs that reset daily or weekly, this version gives you full control to track institutional pricing zones from precise anchor points—such as key swing highs/lows, market open, or news-driven candles.
It’s especially useful for price action and Smart Money Concepts (SMC) traders who track liquidity, fair value gaps (FVGs), and institutional zones.
🇮🇳 For NSE India Traders
You can anchor VWAP to Indian market open (e.g., 9:15 AM IST) or major events like RBI policy, earnings, or breakout candles.
The time input uses UTC by default, so for Indian Standard Time (IST), remember:
9:15 AM IST = 3:45 AM UTC
3:30 PM IST = 10:00 AM UTC
⚙️ How to Use
Add the indicator to your chart.
Open the settings panel.
Under “Anchor Start Time”, choose the date & time to begin the VWAP.
Use UTC format (adjust from IST if needed).
Customize the line color and thickness to suit your chart style.
The VWAP will begin plotting from that time forward.
🔎 Best Use Cases
Track VWAP from intraday range breakouts
Anchor from swing highs/lows to identify mean reversion zones
Combine with your FVGs, Order Blocks, or CHoCHs
Monitor VWAP reactions during key macro events or expiry days
🔧 Clean Design
No labels are used, keeping your chart clean.
Works on all timeframes (1min to Daily).
Designed for serious intraday & positional traders.

Liquidity Grab Strategy (Volume Trap)🧠 Strategy Logic:
Liquidity Grab Detection:
The script looks for a sharp drop in price (bearish engulfing or breakdown candle).
However, volume remains flat (within 5% of the 20-period moving average), suggesting the move is manipulated, not genuine.
Fair Value Gap Confirmation (FVG):
It confirms that a Fair Value Gap exists — a gap between recent candle bodies that price is likely to retrace into.
This gap represents a high-probability entry zone.
Trade Setup:
A limit BUY order is placed at the base of the FVG.
Stop Loss (SL) is placed below the gap.
Take Profit (TP) is placed at the most recent swing high.
📈 How to Use It:
Add the strategy to your TradingView chart (1–5 min or 15 min works well for intraday setups).
Look for green BUY labels and plotted lines:
💚 Green = Entry price
🔴 Red = Stop loss
🔵 Blue = Take profit
The script will automatically simulate entries when conditions are met and exit either at TP or SL.
Use TradingView’s Strategy Tester to review:
Win rate
Net profit
Risk-adjusted performance

Multi-Timeframe S&R Zones (Shaded)This indicator automatically plots support and resistance zones based on recent price action across multiple timeframes:
🟥 Daily
🟧 4-Hour
🟨 1-Hour
🟩 30-Minute
🟦 5-Minute
Each zone is color-coded by timeframe and represented as a shaded region instead of a hard line, giving you a clearer and more dynamic view of key market levels. The zones are calculated from recent swing highs (resistance) and swing lows (support), and each zone spans ±5 pips for precision.
Only the most recent levels are displayed—up to 3 per timeframe—and are limited to the last 48 hours to avoid chart clutter and keep your workspace clean.
✅ Key Benefits:
Price Action Based: Zones are drawn from actual market structure (swings), not arbitrary levels.
Multi-Timeframe Clarity: View confluence across major intraday and higher timeframes at a glance.
Color-Coded Zones: Instantly distinguish between timeframes using intuitive colour coordination.
Clean Charts: Only shows the latest relevant levels, automatically expires old zones beyond 48 hours.
Flexible & Lightweight: Built for Tradingview Essential; optimized for performance.

ICT Liquidity Sweep MAX RETRI (ALERT)Strategy Description: SMC + ICT Reversal Sniper | 5-Min | R2 TP
This strategy applies Smart Money Concepts (SMC) and ICT methodology to identify high-probability reversal trades using a clean, rule-based system designed for the 5-minute timeframe.
⸻
Core Logic:
• Liquidity Sweep: Identifies stop hunts beyond recent swing highs/lows using a configurable lookback window.
• Break of Structure (BOS): Validates a directional shift after the sweep.
• Fixed R2 Risk-Reward: Entry is followed by a 2:1 take-profit target. Stop loss is set at the sweep candle’s high/low.
• No Entry Between 8 PM–12 AM NY Time: Avoids the manipulation-prone and illiquid zone.
• Discreet SL Handling: SL hits close trades silently — no labels or visuals.
⸻
Entry Precision & Timing Notes:
• The strategy may occasionally fire before a confirmed liquidity sweep — this is expected. If a sweep occurs later, you may still re-enter toward equilibrium, with take profit also targeted at equilibrium.
• Alerts or trades that trigger near 9:30 AM NY often align with real direction, but this time can be volatile.
• For more reliable and lower-risk entries, focus on the 1:30 PM to 2:00 PM silver bullet window, which tends to produce cleaner setups with more favorable flow. 🖤

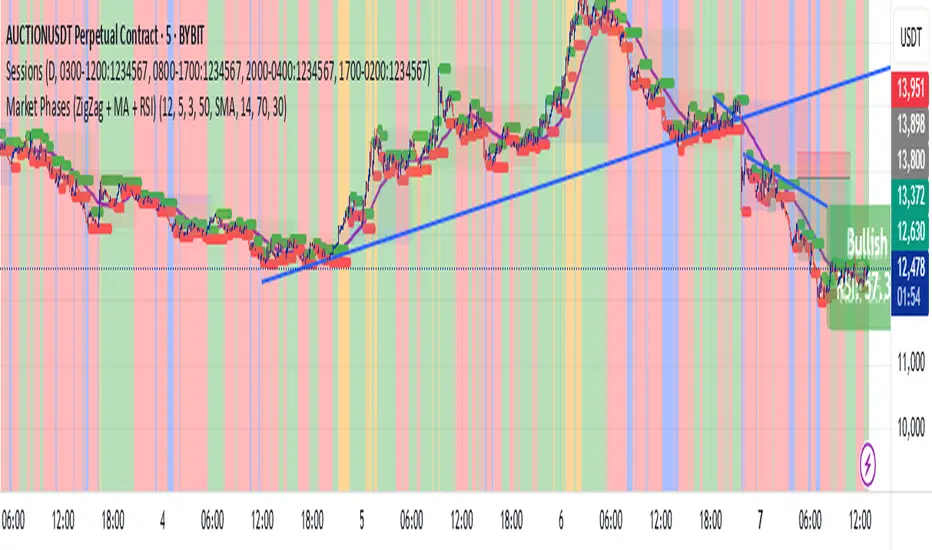
Market Phases (ZigZag + MA + RSI)This script is a TradingView Pine Script that visualizes market phases using the ZigZag pattern, Moving Averages (MA), and the Relative Strength Index (RSI). It allows traders to identify key market conditions, such as accumulating, distributing, bullish, and bearish phases based on price movements and momentum indicators.
#### Components
1. ZigZag Settings:
- Depth: Controls the sensitivity of the ZigZag indicator. A higher value results in fewer price points being considered as reversals.
- Deviation: Defines the minimum percentage change needed to identify a ZigZag point, preventing small fluctuations from being registered.
- Backstep: Specifies the number of bars to look back for identifying highs and lows.
2. Moving Average Settings:
- MA Length: The number of periods used to calculate the moving average.
- MA Type: The type of moving average to use, either Simple Moving Average (SMA) or Exponential Moving Average (EMA).
3. RSI Settings:
- RSI Length: The period for calculating the RSI.
- Overbought Level: The threshold above which the asset is considered overbought.
- Oversold Level: The threshold below which the asset is considered oversold.
4. Calculations:
- Moving Average and RSI Calculation: The script calculates either an SMA or EMA and the RSI based on user-defined settings.
5. ZigZag Enhanced Calculation:
- It identifies swing highs and lows to determine the ZigZag points for improved trend analysis.
6. Trend Direction:
- The script checks the direction of the trend based on the latest ZigZag points.
7. Market Phase Determination:
- The script defines the market phase (Accumulation, Distribution, Bullish, Bearish) based on the trend direction and levels from the RSI and relationship with the moving average.
8. Background Colors:
- The background is tinted according to the identified market phase for visual clarity.
9. Labels and Plotting:
- Labels are generated at the last bar with the current phase and RSI value.
- The moving average and last ZigZag points are plotted on the chart for further reference.
### Conclusion
This script provides a comprehensive view of market conditions by integrating multiple indicators, helping traders make informed trading decisions based on market dynamics. The ability to visualize phases and key indicators aids in recognizing potential entry and exit points in trading strategies.
If you have any questions or need further modifications, feel free to ask!
Sahid Strategy v2This script identifies potential buy/sell signals using:
Pivot Points - Detects swing highs/lows (price reversals)
Confirmation Filters - Reduces false signals using:
RSI (momentum)
Moving Average (trend direction)
Optional MACD (trend confirmation)
Key Features
Signal Type Trigger Conditions
BUY - Price makes a swing low (pivot)
Copy
- RSI ≤ 30 (oversold)
- Price above trend MA
- MACD bullish (optional) |
| SELL | - Price makes a swing high (pivot)
- RSI ≥ 70 (overbought)
- Price below trend MA
- MACD bearish (optional) |
Visual Signals
Green "BUY" labels below price bars
Red "SELL" labels above price bars
Purple trend line (20-period EMA/SMA)
Orange/blue circles showing raw pivot points
Optional Tools
Debug Table (top-right): Shows real-time:
RSI value
Price vs MA position
MACD status
Alerts - Triggers audible/visual notifications
Customization
Adjust in settings:
Pivot sensitivity (left/right bars)
RSI levels (30/70 by default)
MA type/length (20-period EMA/SMA)
Toggle MACD filter on/off
Best For: Swing trading in trending markets (1H-4H timeframes). Signals appear faster than classic pivot strategies but still require confirmation from other analysis tools.
Fibonacci & Bollinger Bands StrategyTrading System: Fibonacci & Bollinger Bands Strategy
1. Session Timing
Trade only from 1 PM onwards.
Identify the first candle on the 1 PM vertical line to set the market direction.
If it's a bullish candle, look for buy opportunities.
If it's a bearish candle, look for sell opportunities.
2. Fibonacci Retracement as a Measuring Tool
Identify the recent swing high and swing low before the 1 PM session.
Draw Fibonacci retracement levels from low to high (for buys) or high to low (for sells).
Key retracement levels to watch: 0.0%, 50.0%, and 100.0%.
Entries can be placed at 0.0% or 50.0%, aiming for a move toward 100.0% retracement.
3. Bollinger Bands Confirmation
If the Bollinger Bands are above price, expect a downward move (sell).
If the Bollinger Bands are below price, expect an upward move (buy).
Use this as additional confirmation for your Fibonacci-based trade.
4. Entry & Exit Rules
Entry:
If the 1 PM candle confirms a bullish bias, enter long near Fibonacci 0.0% or 50.0%.
If the 1 PM candle confirms a bearish bias, enter short near Fibonacci 0.0% or 50.0%.
Stop Loss: Below (for buys) or above (for sells) the swing low/high used for Fibonacci.
Take Profit: Target 100.0% retracement level or next key resistance/support.
5. Risk Management
Risk 1-2% per trade.
Avoid trading if price is too far from Fibonacci levels.
Confirm setup with Bollinger Bands alignment.
